Nearly 7 in 10 breaches start with an asset no one knew existed. GreyMatter identifies those breaches quickly, but it didn’t do anything to prevent them. Discover gave GreyMatter customers visibility into their attack surface for the first time to help close that gap.

We connected to everything but couldn’t tell the user what was connected
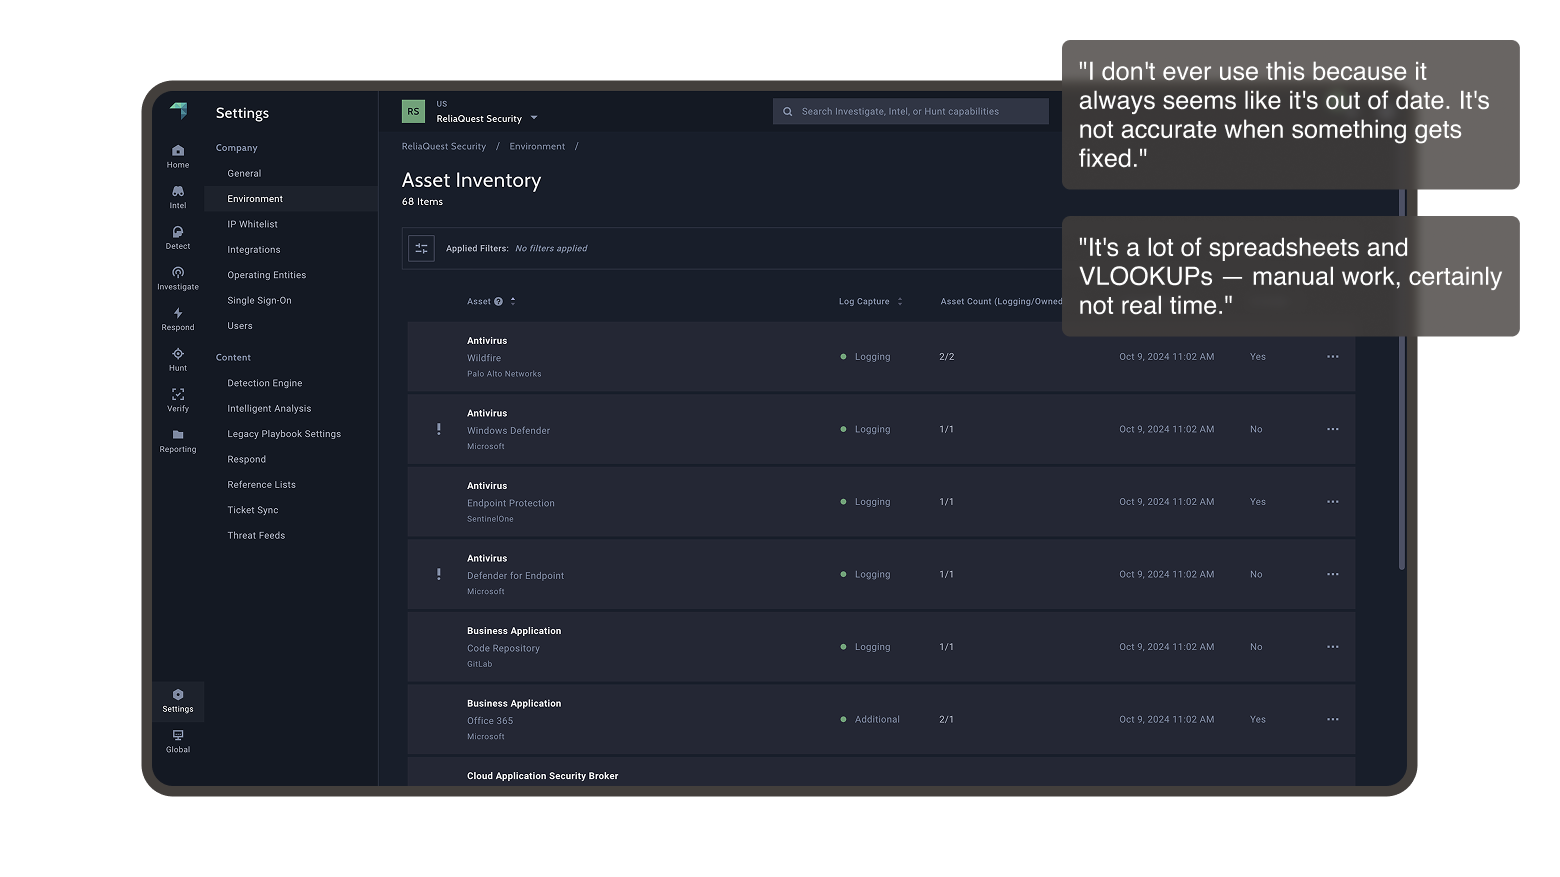
Before Discover, GreyMatter's asset inventory was a static table that customers populated themselves. Instead of us acting as their security expert, it required our customers to be experts. It was slow, delayed onboarding, and often outdated.
26 sessions across 17 customers
I led all research sessions across the project lifecycle, working alongside my Product Manager Haley Nichols, who handled technical questions that arose during the calls. Sessions were uploaded to Dovetail to identify and highlight feedback, as well as create clip reels to share with stakeholders. Each phase of research revealed new findings, but the consistent thread was always the same: users needed to be able to trust what they were seeing.
Three phases over 18 months
Discover shipped across three phases. Each one answered a harder version of the same question: what does a security team actually need to know?
- Phase 1: What's connected, how, and is it working?
- Phase 2: What assets, Identities, and software make up my Attack Surface?
- Phase 3: What's exposed, where am I vulnerable, and how do I fix it?
- Phase 1: What's connected, how, and is it working?
- Phase 2: What assets, Identities, and software make up my Attack Surface?
- Phase 3: What's exposed, where am I vulnerable, and how do I fix it?
Thousands of assets. No way to find the ones that matter.
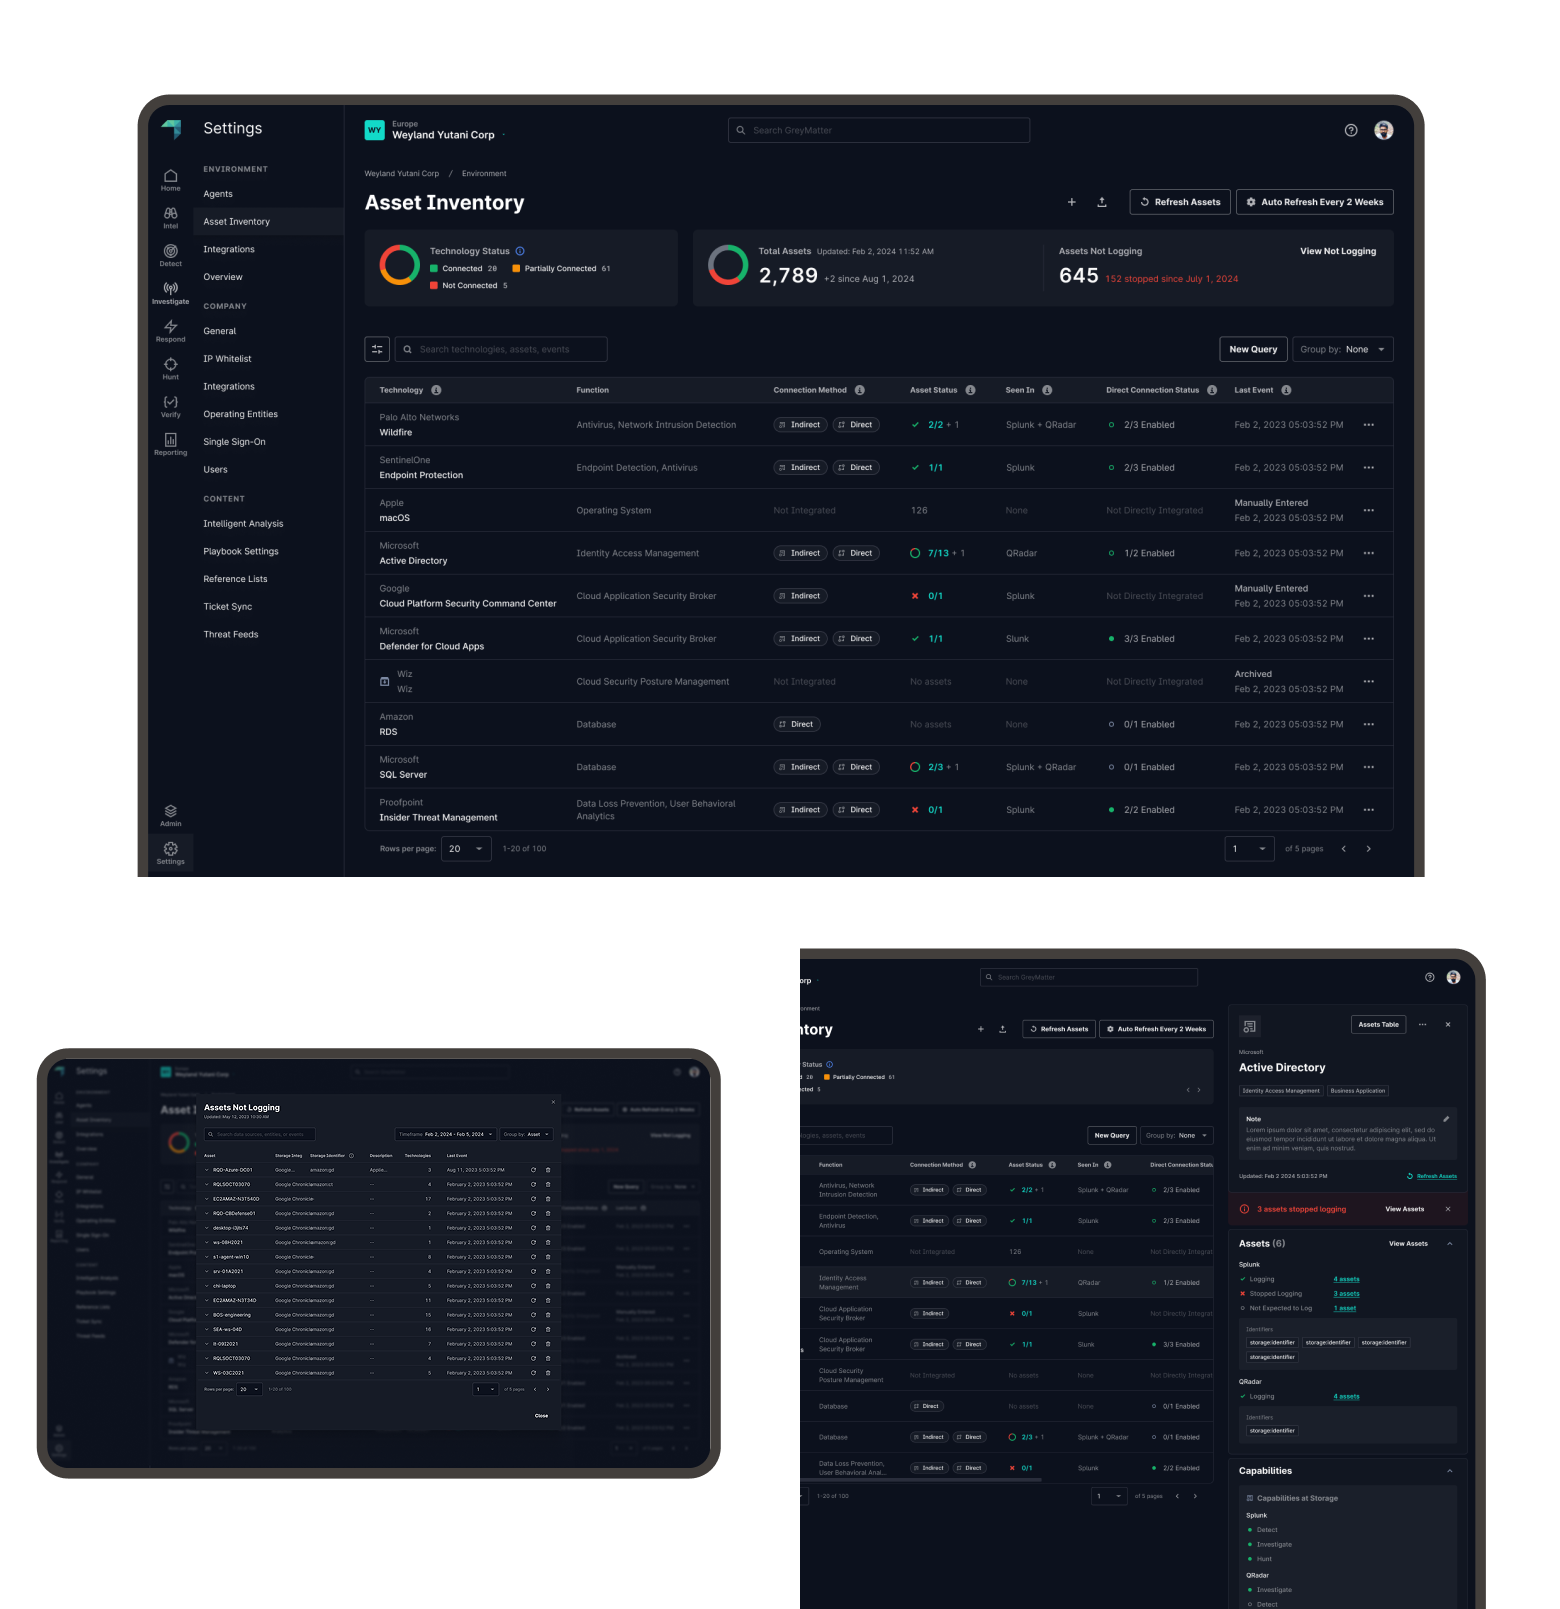
Bringing asset data into GreyMatter for the first time created an immediate problem. The sheer amount of data we had meant we had to be very intentional about which columns to put in our assets table.The original sources page listed connected tools but didn't tell customers whether those tools were functioning.
"I just need to understand what assets have security tools, which ones don't, and which exist with absolutely nothing — that's the only gap I'm trying to solve.""As a customer, I want to see if my thing is working right now. They have no idea when it's not working — and then they get pissed and have no idea why."
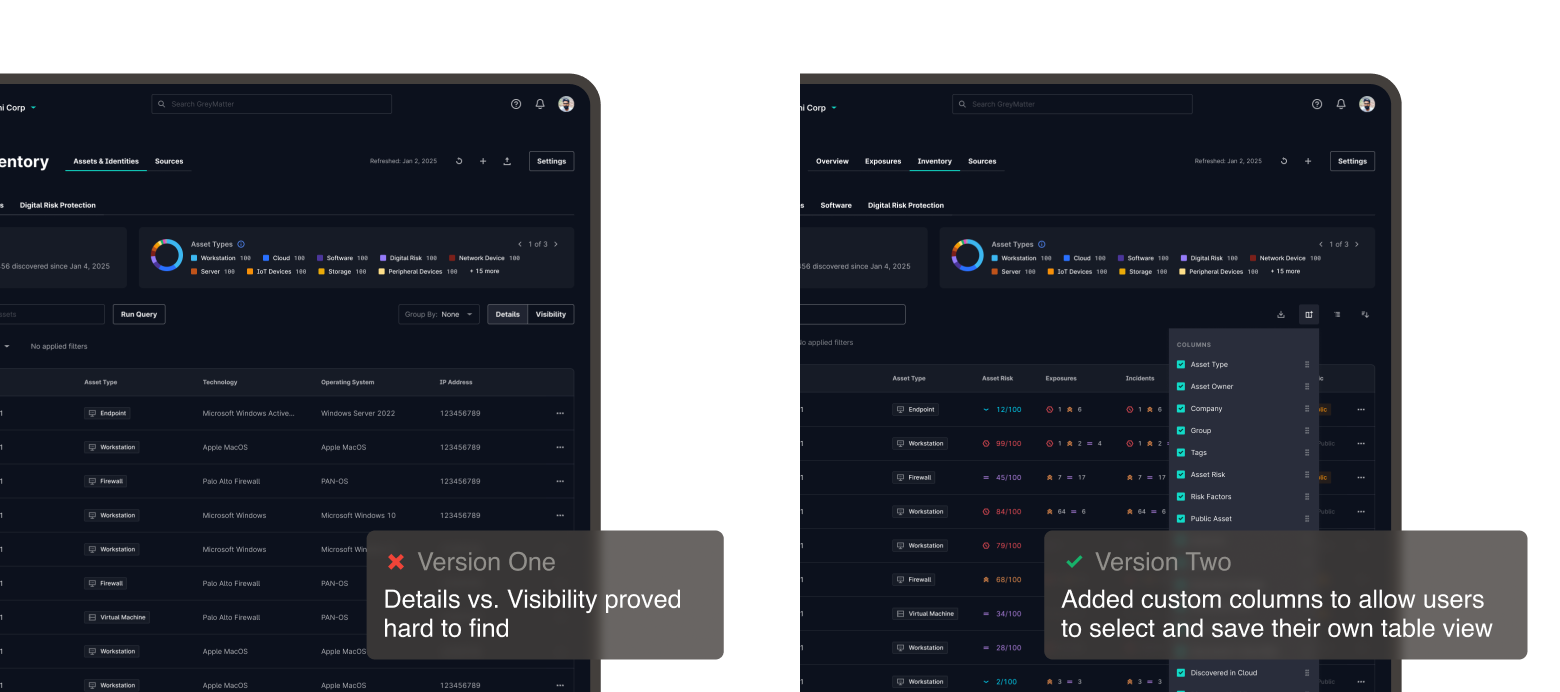
During validation calls, I noticed there were two top level questions users were asking about each asset: What is it and how did Discover find it? Further calls helped me define which data points would help answer each question - but there were a lot of columns. I decided to group each set into a table switcher, one set of columns to show what the asset was and one set to show where we found it, labeled Details and Visibility. After release, one of the most common bits of feedback I heard was that users didn’t know where their assets were coming from. I realized that the Visibility view - the view that answered those questions - was largely undiscoverable. Around this time, I was also hearing requests for other columns and decided it was finally time to add something I’d heard requested from day one of joining ReliaQuest - Custom Columns.
The custom columns conversation was happening at the same time as another important conversation around a granular way of searching assets. Working with my PM Haley, we prioritized a way to search assets with a more indepth query builder, but this had its own set of issues. For one, the filter/condition options were inconsistent between the two. There was also an engineering constraint disabled filtering on query searches.
In both of these scenarios, ultimately users couldn't find what they were looking for. This, combined with growing inconsistency across tables platform-wide, felt like the right moment to improve our filtering and table actions pattern for good. This meant a redesign of all of filtering, creating a filter menu that could switch between a Basic view with standard checkbox and radio buttons, and an Advanced view that converted all of the filter options into a condition builder. I also added in Custom Columns and a way to save those columns and filters with saved views. Finally, I added consistency around table grouping, export, and sorting so that all tables in GreyMatter were consistent in both layout and functionality.
"I just need to understand what assets have security tools, which ones don't, and which exist with absolutely nothing — that's the only gap I'm trying to solve.""As a customer, I want to see if my thing is working right now. They have no idea when it's not working — and then they get pissed and have no idea why."
During validation calls, I noticed there were two top level questions users were asking about each asset: What is it and how did Discover find it? Further calls helped me define which data points would help answer each question - but there were a lot of columns. I decided to group each set into a table switcher, one set of columns to show what the asset was and one set to show where we found it, labeled Details and Visibility. After release, one of the most common bits of feedback I heard was that users didn’t know where their assets were coming from. I realized that the Visibility view - the view that answered those questions - was largely undiscoverable. Around this time, I was also hearing requests for other columns and decided it was finally time to add something I’d heard requested from day one of joining ReliaQuest - Custom Columns.
The custom columns conversation was happening at the same time as another important conversation around a granular way of searching assets. Working with my PM Haley, we prioritized a way to search assets with a more indepth query builder, but this had its own set of issues. For one, the filter/condition options were inconsistent between the two. There was also an engineering constraint disabled filtering on query searches.
In both of these scenarios, ultimately users couldn't find what they were looking for. This, combined with growing inconsistency across tables platform-wide, felt like the right moment to improve our filtering and table actions pattern for good. This meant a redesign of all of filtering, creating a filter menu that could switch between a Basic view with standard checkbox and radio buttons, and an Advanced view that converted all of the filter options into a condition builder. I also added in Custom Columns and a way to save those columns and filters with saved views. Finally, I added consistency around table grouping, export, and sorting so that all tables in GreyMatter were consistent in both layout and functionality.
Two users: one with GreyMatter, one without
Once I started mapping the Exposure lifecycle, it became clear I was designing for 2 users: Discover users who needed to find and prioritize Exposures, and IT teams who weren’t in GreyMatter but were the ones to mitigate the Exposures. More importantly, my designs needed to act as a fail safe if communication between the two users broke down.Square was also looking to expand on the existing Reserves system by creating a variable version called Tiered Reserves. This new Tiered Reserves System added 1-2 selling limits where your reserves change, so a seller’s reserve terms would change as they progressed throughout the month, quarter, or year - depending on their terms. Our new dashboard needed to include these extra variables and show the reset schedule for your tiers, the limits where your reserves change, and 1-2 additional reserve percentages.
"The export is a good idea because we may need to share this with IT — it's our responsibility to be aware of it, but it's theirs to do." — Customer, Exposure Management research
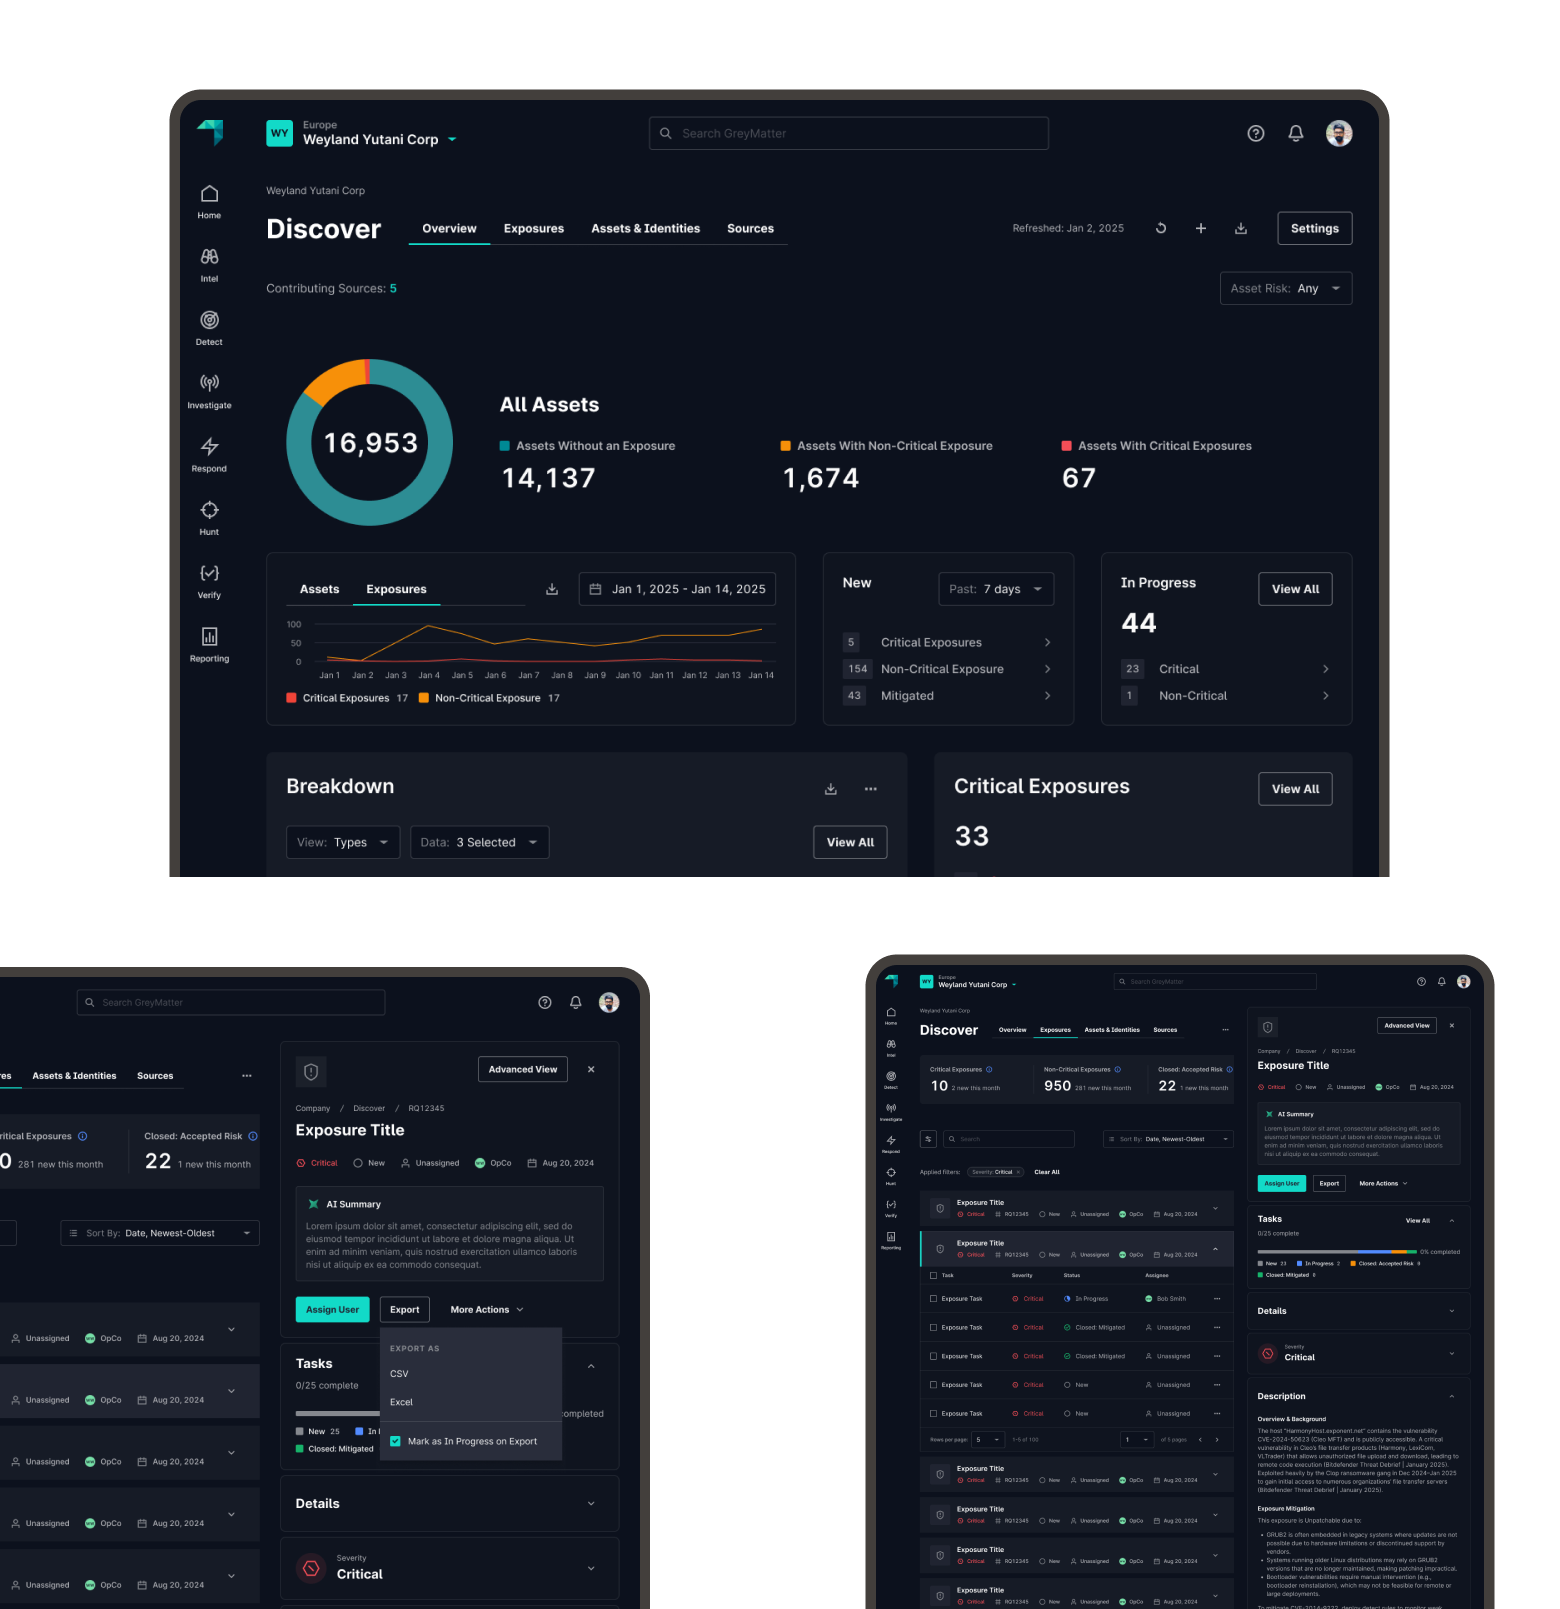
For Discover users prioritizing exposures, I needed to solve the question, “What needs my attention the most?” The first step was being intentional about what qualified as a critical exposure. We utilized our risk engine that set severity based on Asset risk, Exposure risk, and if there was any threat intelligence that was related to the exposure. Once I knew what was critical, I surfaced that information throughout the overview dashboard, calling out Critical Exposure with Critical assets and active exploits. I also added an attack surface breakdown so users could see the makeup of their attack surface by asset type, tag, or public accessibility with exposure risk segmenting the bar graphs.
To help track exposure handoff and to make sure nothing fell through the cracks, I added progress tracking to the export user flow. Discover users can mark as In Progress on export, as well as assign non-GreyMatter users so they can track who they send the exposure info to. In case of communication breakdown, I added an Exposures In Progress card to the overview to show aging exposures. This in combination with exposures auto closing when mitigated, allowed Discover users to catch any un-mitigated or partially mitigated exposures they had sent.
Throughout the process of designing and user testing the overview page, I was very intentional about surfacing all the information users needed without making it too noisy. Playing around with a lot of layouts, I ended up with a structure of: how big is my attack surface, what exposures are in my environment, and what more granular information can I drill into? I used our primary and secondary card treatments, along with varying card size, to create hierarchy rather than a uniform grid, keeping every card at least partially above the fold so nothing was fully hidden.
"The export is a good idea because we may need to share this with IT — it's our responsibility to be aware of it, but it's theirs to do." — Customer, Exposure Management research
For Discover users prioritizing exposures, I needed to solve the question, “What needs my attention the most?” The first step was being intentional about what qualified as a critical exposure. We utilized our risk engine that set severity based on Asset risk, Exposure risk, and if there was any threat intelligence that was related to the exposure. Once I knew what was critical, I surfaced that information throughout the overview dashboard, calling out Critical Exposure with Critical assets and active exploits. I also added an attack surface breakdown so users could see the makeup of their attack surface by asset type, tag, or public accessibility with exposure risk segmenting the bar graphs.
To help track exposure handoff and to make sure nothing fell through the cracks, I added progress tracking to the export user flow. Discover users can mark as In Progress on export, as well as assign non-GreyMatter users so they can track who they send the exposure info to. In case of communication breakdown, I added an Exposures In Progress card to the overview to show aging exposures. This in combination with exposures auto closing when mitigated, allowed Discover users to catch any un-mitigated or partially mitigated exposures they had sent.
Throughout the process of designing and user testing the overview page, I was very intentional about surfacing all the information users needed without making it too noisy. Playing around with a lot of layouts, I ended up with a structure of: how big is my attack surface, what exposures are in my environment, and what more granular information can I drill into? I used our primary and secondary card treatments, along with varying card size, to create hierarchy rather than a uniform grid, keeping every card at least partially above the fold so nothing was fully hidden.
A last-minute architecture change that required falling back on user research
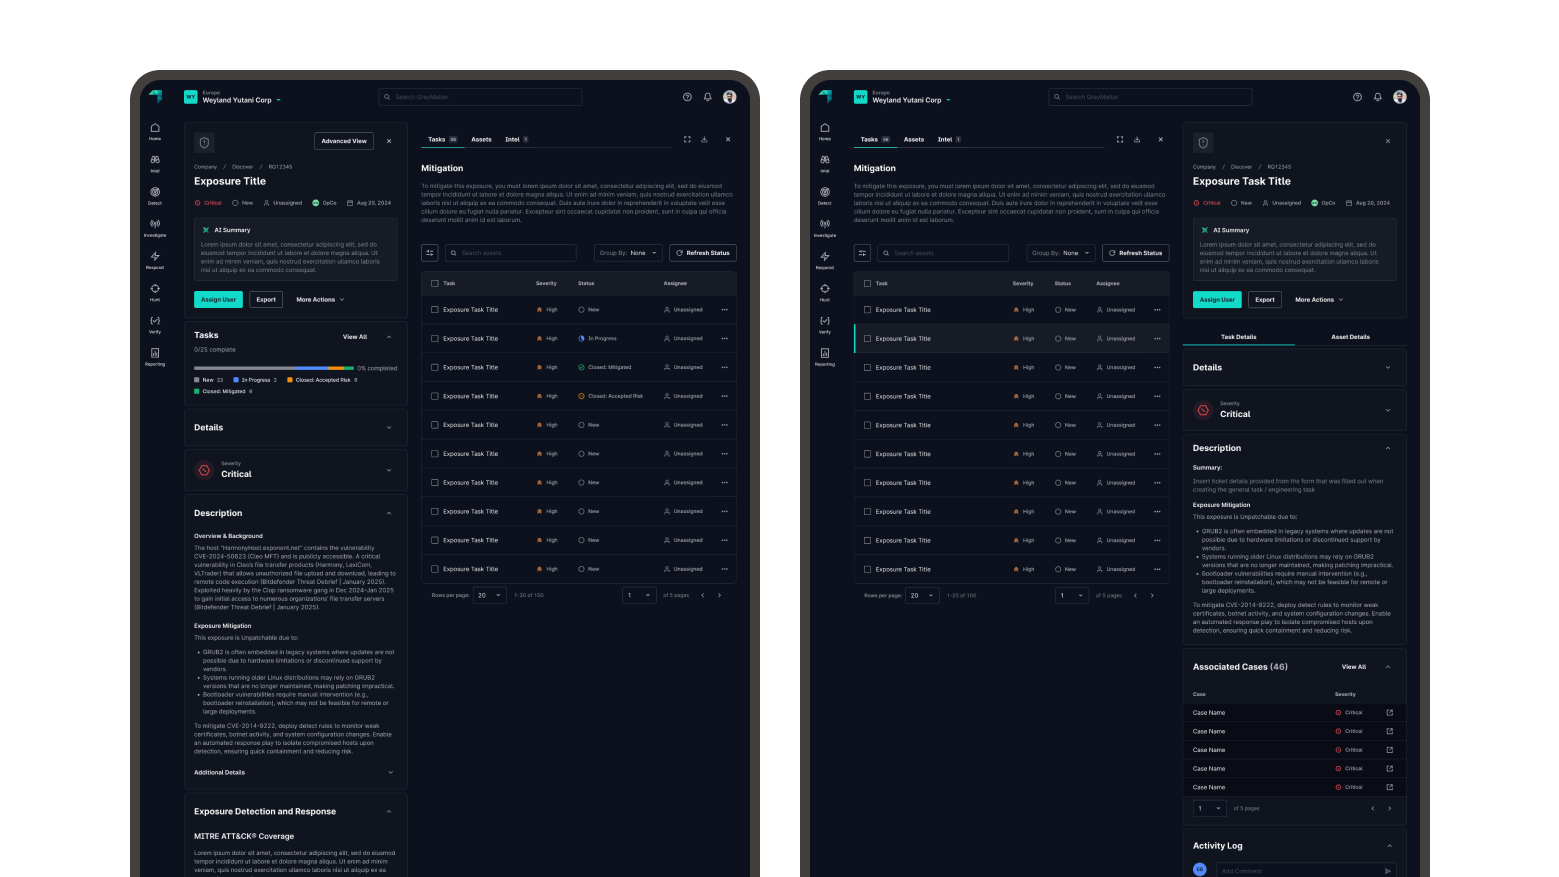
Late in the project, with handoff documents ready and engineering about to start, leadership restructured the exposure management model, removing grouped exposures and adding individual tasks for each asset exposed. There were legitimate business reasons for the change - Exposure Management would now be built off of Case Management architecture - but research had shown users needed Asset information to drill into for their exposures, not task information. Because case tasks didn't have asset details, ours wouldn't either. I knew based on all our research calls that a table with asset details was necessary, so I retained it as a separate tab in the advanced view. I also added relevant detail information to the task pane so users could access it from both tables.
One recommendation I insisted on that wasn't built for MVP was that exposures should auto close when fully mitigated. After release we found the built model was causing confusion because 1) Discover users weren't the one mitigating exposures so they weren't tracking and closing them out manually, and 2) When an asset was mitigated it disappeared from the Asset table but the task was marked complete. Both of these resulted in a lot of open exposures with zero assets, which degraded the users trust. We quickly pivoted and added in the auto close functionality to cut down on manual work and confusion.
One recommendation I insisted on that wasn't built for MVP was that exposures should auto close when fully mitigated. After release we found the built model was causing confusion because 1) Discover users weren't the one mitigating exposures so they weren't tracking and closing them out manually, and 2) When an asset was mitigated it disappeared from the Asset table but the task was marked complete. Both of these resulted in a lot of open exposures with zero assets, which degraded the users trust. We quickly pivoted and added in the auto close functionality to cut down on manual work and confusion.